Excel connected to a Power BI dataset
“Wow that dashboard looks great! Now show me how i can get that data into Excel” - Ever heard this? What do you do next?
When a Power BI dataset is published to the service it really is more than just “data”. It is typically a semantic model with business domain rules, relationships and calculations all embedded conveniently into a high performance analytical cube.
The main ways to use Excel against Power BI data are-
- Analyse in Excel: Subject to permission settings on the dataset, you can establish a connection between Excel and the dataset located in the Power BI service. By default this will show up as a standard Excel Pivot table which you may interact with live; in the usual way.
- Export to Excel: Each visual element on Power BI dashboard typically offers a “Data Export” option sending the relevant extract to a CSV file for you to open in Excel. And finally,
- Query using DAX from Excel: Excel tables can be configured to connect to a Power BI dataset and run a DAX query against the full data model / cube. Provided that the results of the query are less than a million rows, the Excel Table will be populated with all rows returned by that query.
This blog aims to highlight the third option
Query using DAX from Excel
Microsoft 365 Excel gives users the option to “Get data” from Excel by browsing the Power BI service and selecting any dataset (cube) that they are authorized to access. This simplifies the first step - namely
Step 1 - Establish a connection
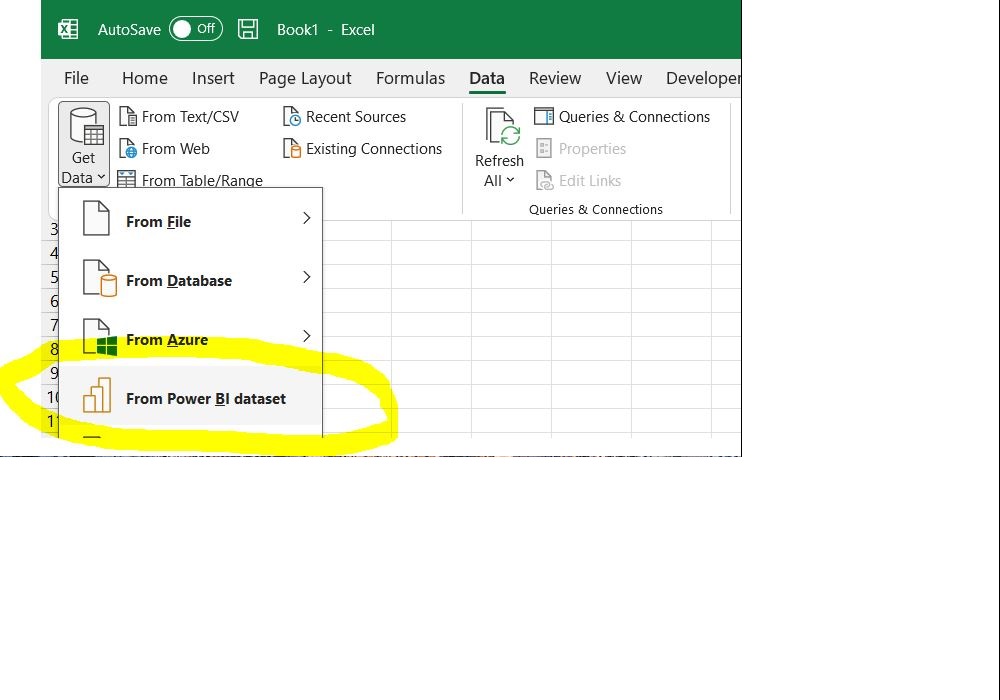
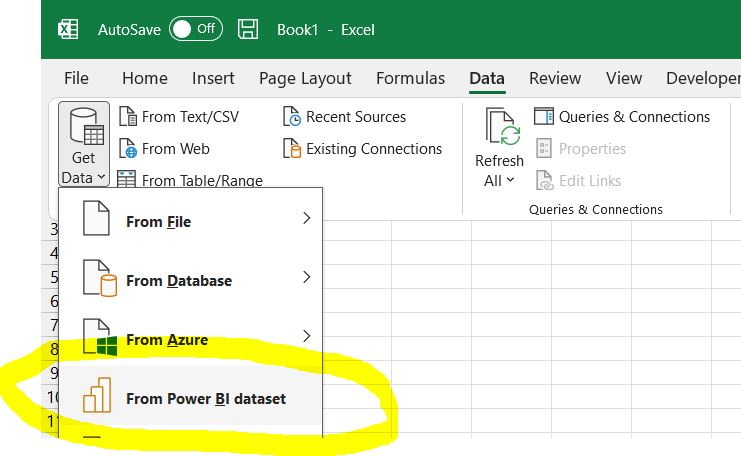
To establish a connection and visualise some data in a pivot table in one click ( see screen image below ) the first step is top line menu DATA. Next choose GET DATA. And then choose FROM POWER BI DATASET
A panel will open on the right listing all of the Power BI datasets that you’re authorised to see. Choose one of these.
Step 2 - Select fields for the Pivot table
In the usual way you can pick a numerical value field and a row field to get some values to show up. Like this.. The row has a Chain name field and the Values field well contains Average Selling Area Size
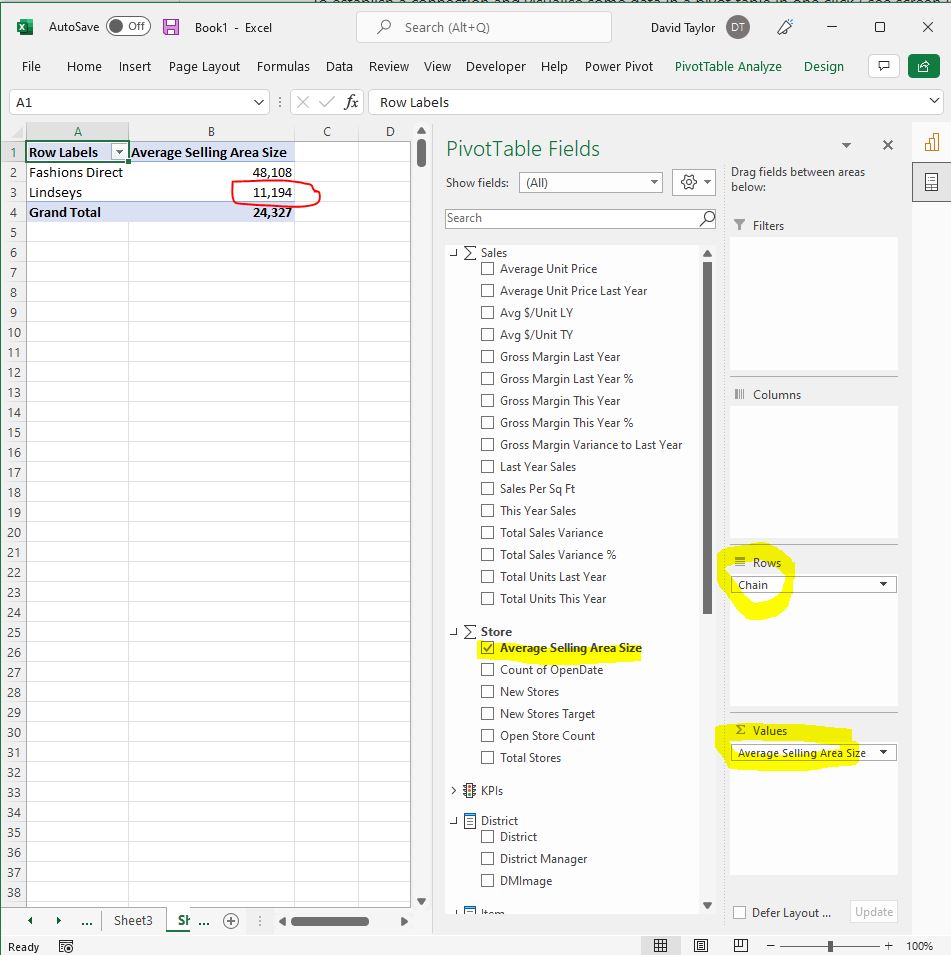
In red pen you can see a value of 11,194 which is the average selling area for the Lindseys Chain of stores. Notice too that the Pivot chart show various fields measures and even KPIs all prebuilt for our custom analysis. This is the power of Power BIs dataset or cube.
While a Pivot table analysis is useful, the advanced analyst will reach for DAX as a query language via the next steps. They are then unconstrained by the strict structure of Excel’s pivot table.
Step 3 - Share this connection with an Excel Table
An Excel Table is automatically connected and the connection we’ve established is automatically shared with that table by simply drilling into a number on our pivot.
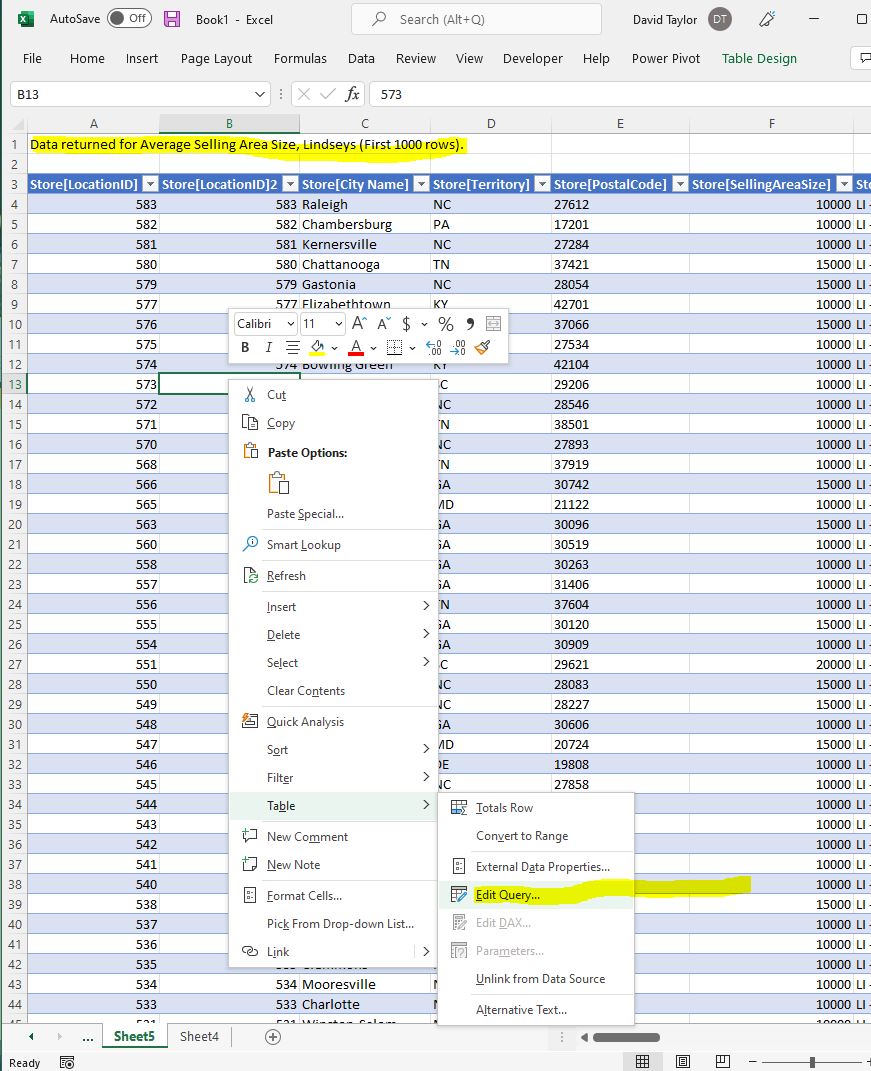
So either right click and menu tooltip option “show details” or simply double click on say the value 11,194 will bring up a drill through table’
Excel will populate another sheet and return the first 1000 rows of data relating to this number. We don’t really care about the contents of this table. This was a means to create a linked table and as you can see from the image below, we right click inside the table to get to the menu option that we need. Namely to Edit the query ourselves.
 ’
’
Step 4 - Get a DAX Query running
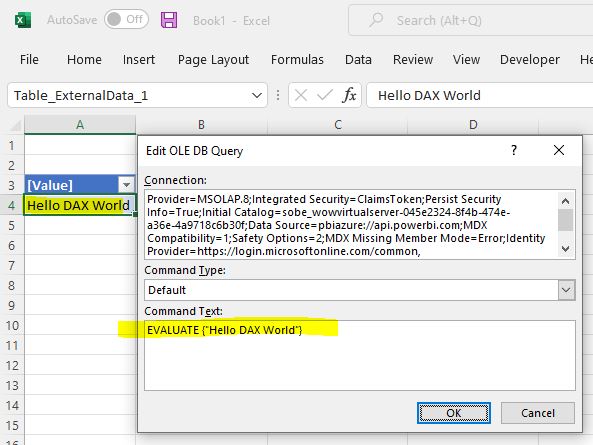
Well the simplest DAX query is a Table containing one value that says “Hello DAX World” and that query is this
EVALUATE {“Hello DAX World”}
Replace the query text with this to get a result in the Excel table as expected.
 ’
’
So you can see above that the contents of the Query Command Text box is our DAX code. And the result is shown in the table to the left.
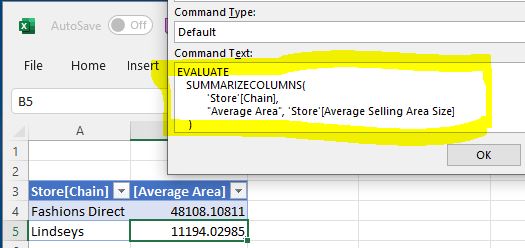
Similarly other code like EVALUATE SUMMARIZECOLUMNS(‘Store’[Chain], “Average Area”, ‘Store’[Average Selling Area Size] ) can demonstrate that the dataset is connected and available to us.
So that’s it. From here you can use DAX as a query language within Excel and get a table of up to a million rows to share with your business users from your Power BI dataset.
 ’
’
Have fun!’
